 |
Minerals Exploration Statistics |

|
This page takes a broader look at
minerals exploration in the Northern Territory and further afield. It summarises the
current economic situation of mineral explorers in Australia and presents data on the
levels of exploration on Aboriginal land.

- Due to the fall in commodity prices in 1998 (spot prices
for uranium fell to less than US$10/lb) the overall situation for mineral explorers is not
bright. In mid 1998 nearly half of the 300-odd mining exploration companies on the
Australian Stock Exchange had all but run out of cash. As at June 30 more than 120 junior
explorers had less than $500,000 in cash and 60 had less than $200,000. Many are
desperately seeking joint-venture partners or negotiating mergers. Maybe 25% of junior
explorers will go out of business (The Bulletin 10/11/98: p54).
- Companies with mine earnings were generally able to
weather the commodity price downturn. However, those without cashflow - including mineral
explorers - were trampled by the investor stampede into safer stocks. The All Resources
Index lost 8.5% between 31 December 1997 and 30 November 1998. The Eyres Reed Explorers
Index lost 16% (Australia's Mining Monthly Dec 1998 - Jan 1999).
- No wonder then that the NT Government announced the NT
Exploration Initiative in 1998. An initial outlay of $0.5 million was added to the NTDME's
budget for 1998/99 to promote geological surveying and mapping activity. A further $15.5
million will be spent by 2002/03. NT Minister for Resource Development Daryl Manzie said,
"mineral and petroleum exploration is the lifeblood of the mining industry and
underpins the economy of the NT" (NTDME 1998a).
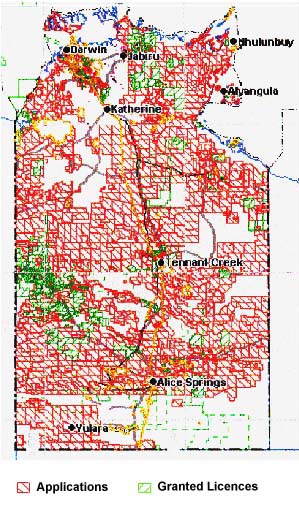
Exploration Licences in the Northern
Territory, June 2001
Source: NT Department of
Mines and Energy
Currently the NT occupies 18% of Australia's land mass but
receives only 7% of exploration investment. In total 456 ELs are held covering 107,724
square kilometres or 8% of the NT. Moreover, the four largest mines (Ranger, Nabalco,
McArthur River, and GEMCO) account for 60% of the value of mining production, which in
1997/98 totalled $1.4 billion (NTDME 1998a; 1998b).
Expenditure on exploration in the NT had declined from $89
million in 1996/97 to $76 million in 1997/98 (NTDME 1998b). Most of this expenditure was
spent on 'Brownfields' exploration (proving up known resources on granted leases) rather
than 'Greenfields' exploration (exploring for new deposits). The NT Government blames
native title uncertainties. 287 ELs were affected by the NT Government's freeze on
applications on land where native title is at issue. Since then the freeze has been lifted
so that the NLC has been inundated by a flood of applications.
In 1997/98, 63 applications were received for ELs on
Aboriginal land. In the same year 19 were granted (NTDMEb 1998b).
As at 30 June 2000, the NLC had processed well over 200
exploration licence applications, of which 76 had progressed to exploration licences.
These cover nearly 46500 km2, so that 30.5% of Aboriginal land in the NLC
region is available for exploration. In addition, the NLC was involved in negotiations for
7 ELAs covering 14500km2 of Aboriginal land in the NLC region.
- At present a total of 39.9% of Aboriginal land in the
NLC region is subject to an ELA or undergoing negotiation towards the grant of an ELA. A
summary of this information is shown in the tables below (NLC Annual Report 1999-2000).
EXPLORATION
LICENCE APPLICATIONS IN THE NORTHERN LAND COUNCIL REGION 1999-2000 |
| Aboriginal land under
Exploration Licence Agreements |
30.5% |
46500km2 |
| Aboriginal land under
ELA negotiation |
9.4% |
14500km2 |
| Aboriginal land for
which ELAs are being processed |
27.7% |
42300km2 |
| Aboriginal land which
has been placed in moratorium |
20.8% |
31700km2 |
| Aboriginal land not
under application |
11.6% |
18000km2 |
| Status |
No.
of ELAs 1 July 1999 - 30 June 2000 |
Cumulative
total to 30 June 2000 |
| Application
due |
9 |
141 |
| Deemed
withdrawn |
1 |
187 |
| Lapsed |
4 |
41 |
| Applications
received |
7 |
300 |
| Under
consideration by traditional owners |
3 |
N/A |
| Negotiations
in progress |
7 |
N/A |
| Refused
by NLC |
22 |
144 |
| Number
of consents given to the grant of exploration licences |
Nil |
76 |
- At a broader scale, Australian resident companies
spent $379 million in exploration for minerals overseas in 1997/98, down 14% on 1996/97.
22% of this investment is targeted at Latin America ($85 million), with Africa getting $76
million and North America $60 million (Minerex Report Vol 7 No. 1 Jan 1999: p12).
More than 40% of Australian exploration investment currently heads overseas (NTDME 1998a).
Refs
Northern Land Council 1998 NLC Submission to the
Land Rights Act Review.
Northern Territory Department of Mines and Energy 1998a The
Northern Territory Exploration Initiative, Darwin.
Northern Territory Department of Mines and Energy 1998b Annual
Report 1997/98, Darwin, October 1998.
Supervising Scientist 1997 Annual Report 1996-97,
AGPS, Canberra.
Uranium Information Centre 1999 Uranium Markets: Nuclear
Issues Briefing Paper 36, January 1999.
|